Ballpark and Weather Factors in Baseball Betting: How Wind, Altitude and Dimensions Shift Totals
The Environmental Variables Most Bettors Ignore
I once backed an Under on a warm, windy night at a hitter-friendly park and watched the total sail past my number by the fourth inning. The starting pitchers performed roughly as expected — the weather did the damage. That loss taught me something no stat sheet could: baseball is an outdoor sport played in 30 different venues across climates ranging from desert heat to Great Lakes chill, and ignoring that environment is like handicapping a horse race without checking the going.
Recreational bettors focus on pitchers and lineups. Sharp bettors add ballpark and weather to every totals assessment. The gap between these two groups is measurable: environmental factors can shift the expected run total by a full run or more in either direction, and the market does not always adjust quickly enough. MLB games averaged 2 hours 36 minutes in 2024, the shortest in 40 years — but the physical environment still dictates how far baseballs fly and how many runs cross the plate.
How Park Dimensions Influence Run Scoring
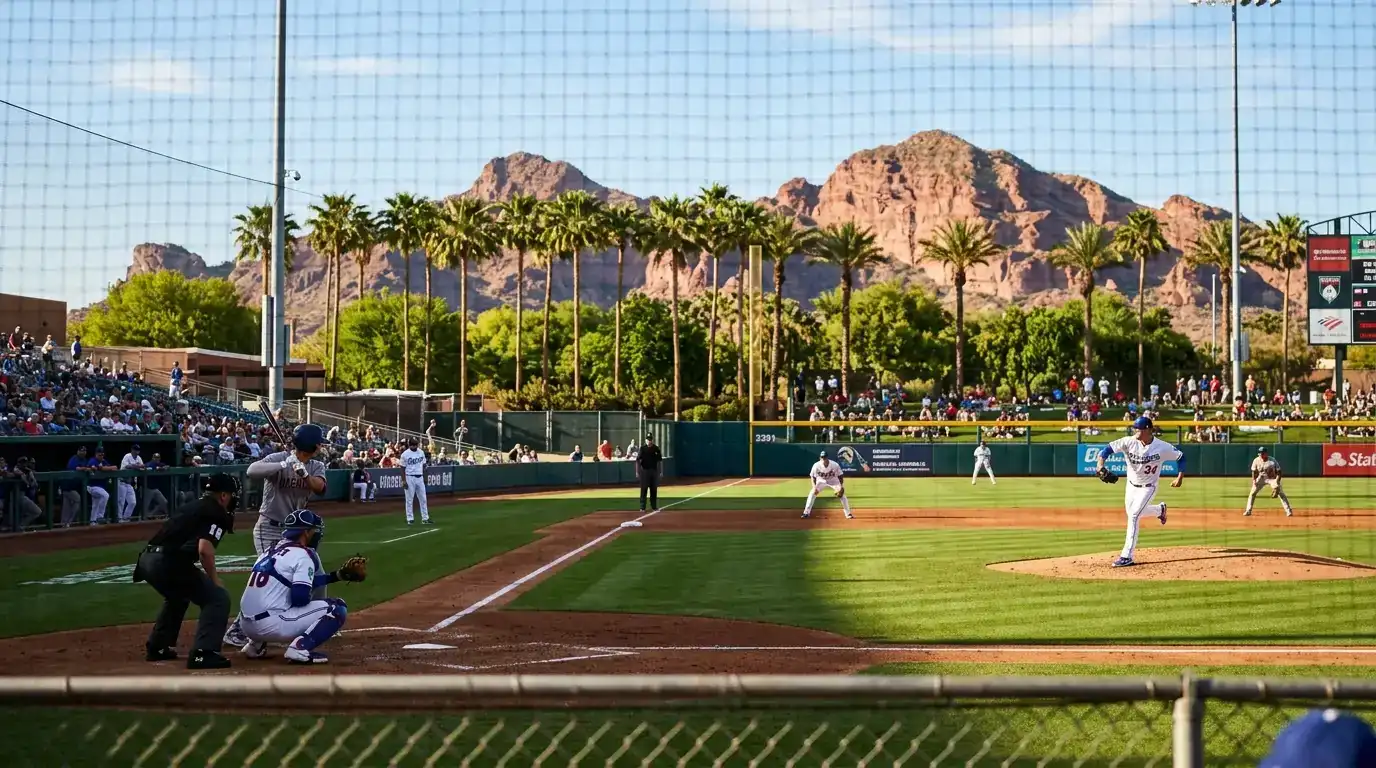
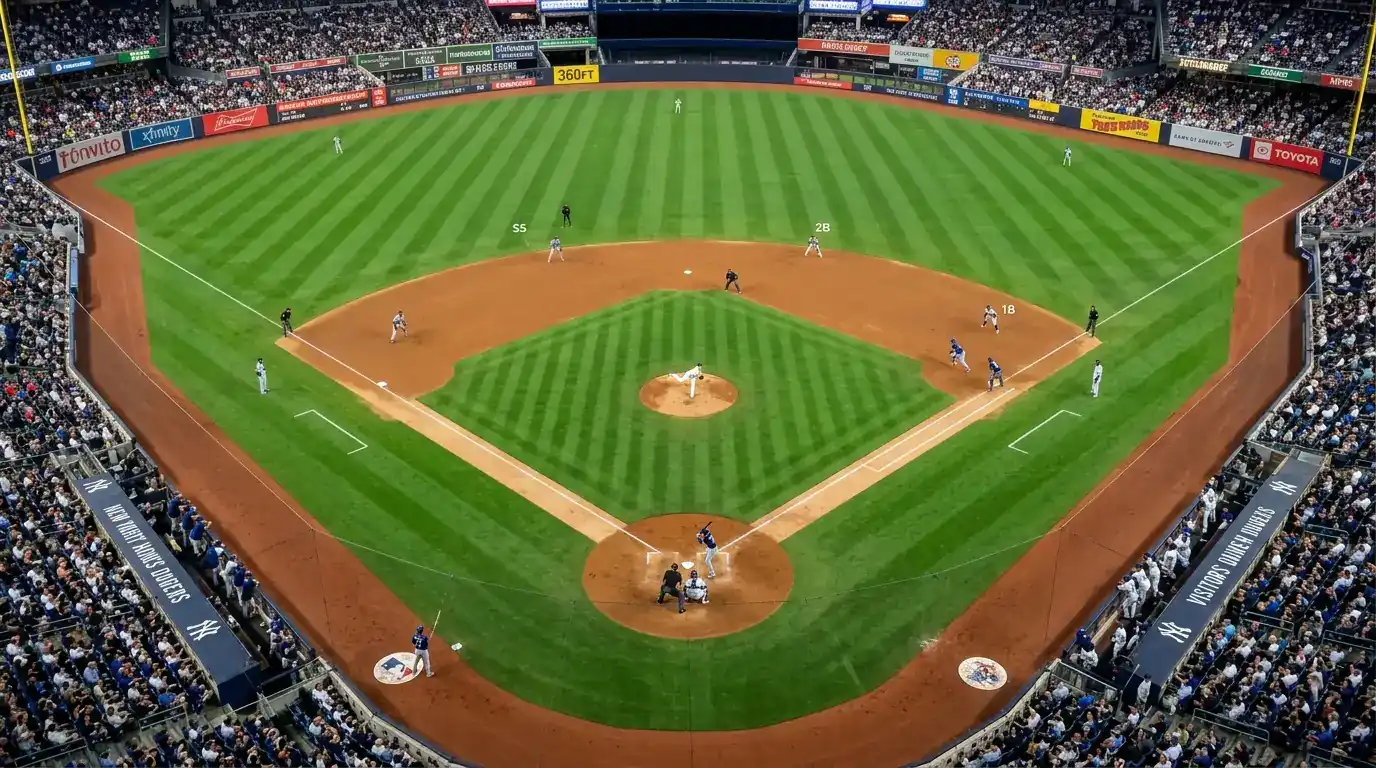
Every MLB ballpark is a unique geometric puzzle. Unlike football pitches, which conform to standardised dimensions, baseball outfields vary dramatically in depth, wall height and overall shape. The distance from home plate to the centre field wall ranges from roughly 390 to 410 feet across the league’s 30 stadiums. Left and right field distances, wall heights and foul territory sizes add further variation.
Park factors quantify this variation. A park factor of 105 means that venue produces 5% more runs than the league average. A park factor of 95 means 5% fewer runs. These numbers are calculated across entire seasons to smooth out sample noise, and they are remarkably stable year over year because the physical dimensions do not change.
The highest-scoring parks consistently sit 15-20% above league average. The lowest-scoring parks suppress runs by a similar margin. That is a swing of 30-35% between the extremes — more than enough to shift a totals line by 1.5 to 2 runs. If you are betting totals without checking the park factor, you are ignoring a variable that moves the line more than most starting pitcher matchups.
Foul territory size is an underappreciated dimension. Parks with expansive foul territory give fielders more room to catch pop-ups that would fall into the stands at smaller venues. Every foul-out that becomes a caught-out at a spacious park is one fewer opportunity for the batter to put the ball in play. Over a full game, this can reduce scoring by 0.2 to 0.3 runs — subtle, but cumulative across a season’s worth of bets.
Wind Direction, Temperature and Humidity Effects
A colleague who models MLB totals for a living told me that his weather adjustment alone generates positive ROI independent of every other variable. I was sceptical until I tracked wind data for 200 consecutive games and saw the pattern myself.
Wind direction relative to the batter’s line of sight is the most impactful weather variable. Wind blowing out from home plate toward the outfield — a «tailwind» for fly balls — carries baseballs further and increases home run probability by a measurable margin. Wind blowing in from the outfield toward home plate suppresses fly ball distance and turns would-be home runs into harmless fly outs. A 15 mph wind blowing straight out can add 0.5 to 1.0 runs to the expected total. The same wind blowing in can subtract a comparable amount.
Crosswinds matter less for totals but create directional effects. Wind blowing from left to right pushes fly balls toward right field, potentially turning routine outs into doubles off the wall depending on the park’s right-field dimensions. This asymmetry affects individual matchups more than game totals, but it is worth noting for player prop bets.
Temperature has a straightforward relationship with scoring: warmer air is less dense, and baseballs travel further through it. Games played above 30 degrees Celsius produce more home runs and higher scoring than games in cold weather. The effect is roughly 0.3 to 0.5 additional runs per game at the highest temperatures compared to the coolest. Spring games in April and early May, when temperatures across much of the US sit in the 10-15 degree range, tend to go Under more frequently than summer games in July and August.
Humidity is the most misunderstood variable. Conventional wisdom says humid air is «heavier» and suppresses fly balls. The physics say the opposite: water vapour molecules are lighter than nitrogen and oxygen molecules, so humid air is actually less dense than dry air, and baseballs travel slightly further through it. The effect is small — perhaps 0.1 to 0.2 runs per game in extreme humidity — but it runs counter to what most bettors assume, creating a persistent misperception in the market.
The Altitude Factor: Coors Field and Beyond
MLB set a record 3,617 stolen bases in 2024, but the most dramatic environmental effect on scoring has nothing to do with base running — it is altitude. At 5,280 feet above sea level, the air density drops enough to increase fly ball distance by roughly 5-9% compared to sea level. The result is more home runs, more extra-base hits, and game totals that routinely clear 10 runs.
The altitude effect at the Denver venue is so extreme that bookmakers set totals 1.5 to 2.5 runs higher than the same pitching matchup would produce at a sea-level park. Despite that adjustment, the Over still hits at an elevated rate in many seasons because the effect is difficult to price precisely. Pitchers who are accustomed to sea-level conditions struggle with reduced movement on breaking balls in thin air, and visiting teams often underperform their season averages defensively because outfielders misjudge fly ball trajectories.
The altitude effect is not binary. Parks at moderate elevations — 500 to 1,500 feet — show smaller but measurable scoring bumps compared to sea-level venues. These intermediate effects are less well-known and less aggressively priced by bookmakers, which makes them a quieter source of totals value. If you are comparing two games with similar pitching matchups and one is played at 1,200 feet while the other sits at sea level, the higher-altitude game has a slight structural lean toward the Over that the totals line may not fully capture.
Practical Tools and Sources for Pre-Bet Weather Checks
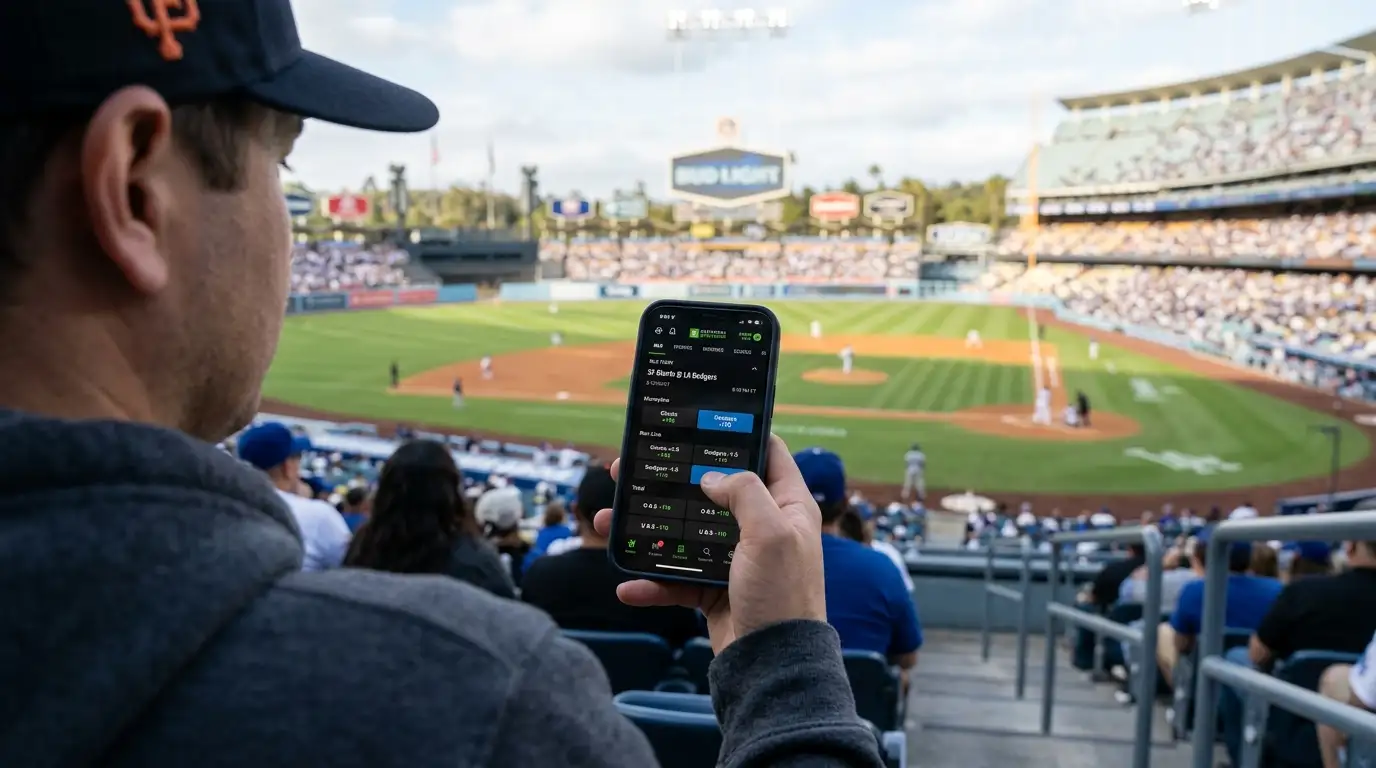
Environmental analysis sounds complex, but the actual pre-bet workflow takes less than five minutes per game. The data is free, publicly available and updated in near real-time.
For park factors, any major baseball statistics site publishes annual and multi-year park factor tables. I use three-year averages to smooth out single-season noise. Bookmark the table and reference it before placing any totals bet — the same way you would check a starting pitcher’s stats.
For weather, a standard forecast for the city where the game is played gives you temperature and humidity. Wind speed and direction require a slightly more granular source — hourly forecasts broken down by location. What matters is wind at game time (usually early evening local time for most MLB games), not the daily average. A day forecast showing 10 mph winds could mean calm conditions at 7 PM if the wind dies down after sunset.
The critical step most bettors skip is orienting the wind relative to the ballpark. A 15 mph south wind at a park where home plate faces south means wind blowing straight out. The same south wind at a park where home plate faces north means wind blowing in. Each MLB stadium has a fixed orientation, and learning the compass direction from home plate to centre field for the 10-15 parks you bet on most frequently takes one evening of research and pays dividends all season.
I combine park factor, wind direction and temperature into a single adjustment that modifies my baseline total by up to 1.5 runs. That adjustment, layered on top of the pitching and lineup analysis I use for totals, produces a projected total I can compare directly to the bookmaker’s line. When my projection diverges from the market by more than one full run, I have a play. When it aligns within half a run, I skip and move to the next game. The environment is not the whole story — but it is the chapter most bettors have never read.
How much can wind add to an MLB total line?
A sustained 15 mph wind blowing out from home plate toward the outfield can add roughly 0.5 to 1.0 runs to the expected game total. The exact impact depends on wind speed, ballpark dimensions and the hitting profiles of both lineups. The same wind blowing in can suppress scoring by a similar margin.
Where can I find real-time ballpark weather data before placing a bet?
Standard weather services provide hourly forecasts for every MLB city. Check wind speed and direction at the expected first-pitch time, then orient the wind relative to the ballpark’s compass direction. Park factor tables are available on major baseball statistics websites and update annually.
Creado por la redacción de «Betting for Baseball».