MLB Batting and Hits Props: Finding Edge in Individual Hitter Markets
 Available in US
Betting on the Batter, Not the Box Score
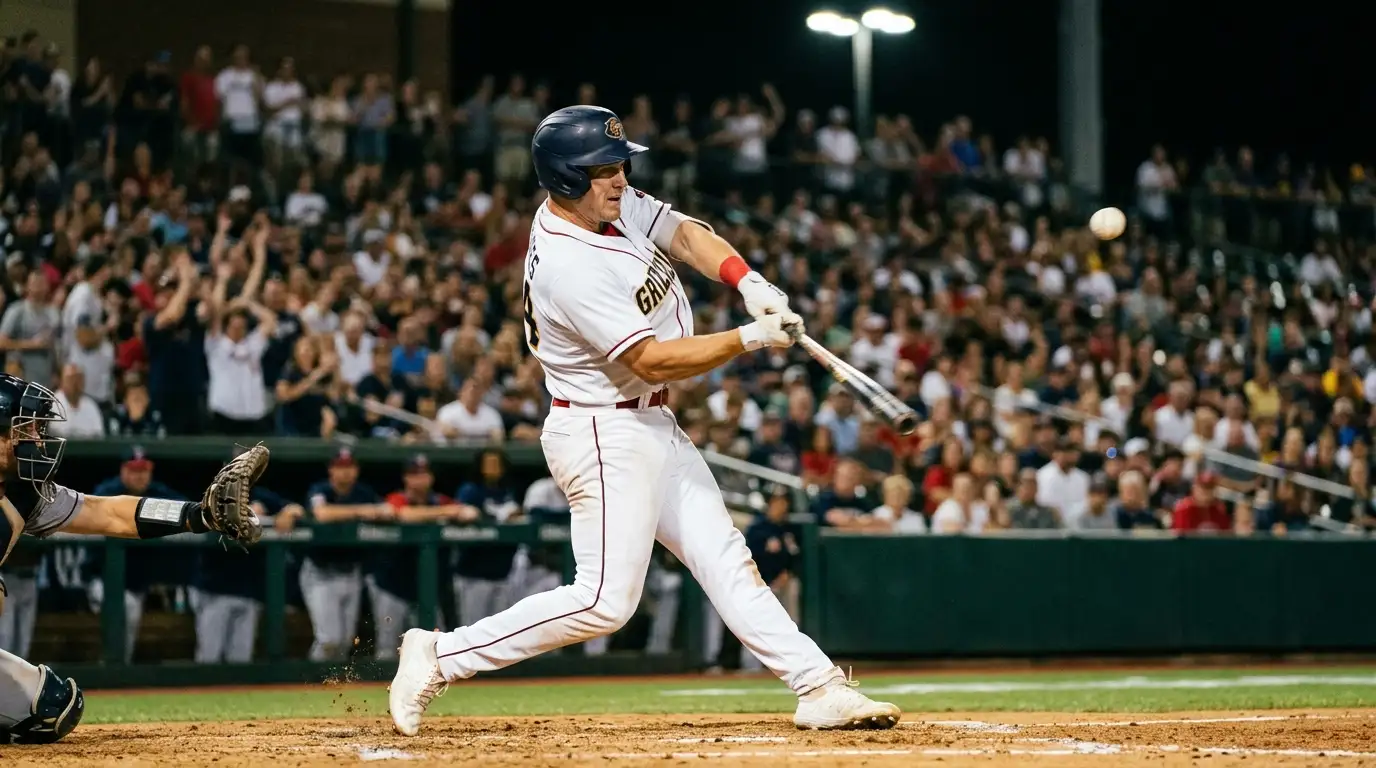
There was a stretch last June where I ignored every moneyline and totals market on the board. For two solid weeks I bet nothing but hitter props — hits, total bases, runs scored — and my ROI outperformed every other category I had tracked that month. The experience was not a fluke. It reflected something structural about how UK sportsbooks price individual batter markets: they rely on season-long averages while the actual performance depends on that night’s specific matchup.
Hitter props ask a simpler question than game-level bets. Will this batter record over or under 1.5 hits? Will he accumulate over or under 1.5 total bases? Will he score a run? Each of these markets isolates a single player’s output from the chaos of the broader game — bullpen collapses, defensive errors, weather shifts — and reduces the analysis to one matchup: batter versus starting pitcher. That simplicity is the appeal. A game can go sideways in a hundred ways, but a batter’s performance against a specific pitcher’s repertoire follows more predictable patterns.
MLB’s 162-game schedule generates an enormous dataset for every active hitter. By mid-season, a regular starter has 300+ plate appearances — enough data to identify genuine skill levels, platoon splits and tendencies against different pitch types. The sportsbook uses this data too, but it prices the prop based on the player’s overall season line. Your edge comes from drilling into the matchup-specific data that the aggregate line smooths over.
Platoon Splits: The Foundation of Every Hits Prop
I learned this lesson the expensive way. Early in my props career, I backed a left-handed hitter’s Over 1.5 hits in a game where he was facing a left-handed starter. His season average was .285 — strong enough to justify the Over at the posted odds. What I failed to check was his split against lefties: .218. He went 0-for-4. The season average had lied because it blended his .320 mark against right-handers with his dismal lefty-on-lefty numbers.
Platoon splits are the single most important variable in hits prop analysis. Most hitters perform measurably better against opposite-handed pitching — right-handed batters hit right-handed pitchers less effectively than left-handed pitchers, and vice versa. The gap varies by player but averages roughly 30 to 40 points of batting average across the league. A .280 hitter overall might be a .300 hitter against opposite-hand pitching and a .250 hitter against same-hand pitching. That 50-point swing is the difference between the Over being a value bet and a losing proposition.
Underdogs win around 43-44% of MLB games, and part of the reason is that underdog lineups often feature hitters with favourable platoon matchups against the favourite’s starting pitcher. If the favourite sends a left-hander to the mound and the underdog’s lineup is stacked with right-handed bats who crush lefties, those individual hitter props become attractive even when the team’s overall quality is inferior. The game outcome might favour the favourite; the individual at-bat outcomes might favour specific underdog hitters.
Pitch Type Vulnerability and Hitter Tendencies
A conversation with a former minor league hitting coach reshaped how I evaluate hitter props. He explained that at the major league level, every hitter has at least one pitch type they struggle with — a hole in their swing that opposing pitchers exploit. The publicly available data now tracks batting average, slugging percentage and whiff rate against every pitch type: four-seam fastball, sinker, slider, curveball, changeup, cutter. If a hitter records a .180 average against sliders and the opposing starter throws sliders 35% of the time, the Over on that hitter’s hits prop is a poor bet regardless of his overall season line.
This analysis takes more time than checking platoon splits, but the edge is proportionally larger because fewer bettors bother with it. The sportsbook’s pricing model incorporates platoon data but is slower to adjust for pitch-type matchups, which shift game to game based on the specific starter. A hitter who thrives against fastball-heavy pitchers will see different results against a slider-dominant arm, and that difference often shows up as mispricing in the hits market.
MLB’s average game duration dropped to 2 hours 36 minutes in 2024 — the shortest in 40 years. The pitch clock has reduced the time between pitches, which affects hitter preparation at the plate. Some hitters have adapted well to the faster pace; others have seen their contact rates decline. Checking a hitter’s batting average specifically in the pitch-clock era (2023 onward) rather than relying on career numbers gives you a cleaner baseline for prop analysis.
Total Bases and the Power Dimension
Hits props measure contact. Total bases props add a power dimension — a home run counts as four total bases, a double as two, a single as one. The over/under on total bases is typically set at 1.5, and the pricing is often tighter than hits props because the distribution of outcomes is wider. A single and a walk produce 1 total base. A home run alone produces 4. That range makes total bases props harder to model and therefore harder for the sportsbook to price precisely.
I focus total bases analysis on two factors: isolated power (ISO, which measures extra-base hit frequency) and the ballpark. A hitter with high ISO in a hitter-friendly park facing a pitcher who allows elevated hard-contact rates is a total bases Over candidate even if his batting average is mediocre. Conversely, a high-average singles hitter in a pitcher-friendly park is better targeted through the hits market than the total bases market, because his output skews toward 1-base outcomes.
MLB recorded a record 3,617 stolen bases in 2024, and stolen bases do not count toward total bases in most sportsbook settlements. A speed-first player who reaches base frequently but lacks power is a poor total bases Over candidate despite producing significant offensive value. Always check your sportsbook’s settlement rules for total bases — some operators include bases reached via walks in their total bases calculation, while others count only bases earned through hits.
Building a Nightly Prop Sheet
Every afternoon during the MLB season, I build a prop sheet for that evening’s games. The process takes 30 to 40 minutes and follows a fixed sequence that eliminates emotion and imposes analytical consistency.
First, I pull the confirmed starting pitchers and identify the relevant handedness matchup for every lineup. Left-handed starters trigger a review of the opposing team’s right-handed bats; right-handed starters trigger the lefty bats. This step immediately narrows the field from 150+ hitters to 30 or 40 who have the platoon advantage.
Second, I check each shortlisted hitter’s batting average and total bases rate against the opposing starter’s primary pitch type. If the starter is slider-heavy and the hitter struggles with sliders, he comes off the list regardless of his platoon split. If the hitter excels against the starter’s pitch mix, he moves to the final filter.
Third, I compare my projected probability for each remaining hitter to the sportsbook’s implied probability from the posted odds. Any hitter where my estimate exceeds the implied probability by five percentage points or more becomes a play. Five points is my minimum threshold — anything less falls within noise, and the sportsbook’s margin eats the edge.
Fourth, I check the ballpark and weather conditions for total bases candidates. Wind blowing out at a hitter-friendly park nudges total bases Overs. Wind blowing in or a deep outfield nudges Unders. This final filter is the same one that applies to game totals, scaled down to the individual level.
The beauty of this workflow is that it produces a clear, defensible list every night. Some nights the list is empty and I bet nothing. Other nights it holds six or seven plays. The process does not care about hunches, streaks or television coverage — it cares about data. Integrating hitter props into a broader pitcher-and-hitter prop strategy creates a diversified prop portfolio that reduces reliance on any single market type.
What is the most important factor for MLB hits props?
Platoon splits — the hitter’s batting average against the specific handedness of the opposing starter — are the strongest single predictor. A hitter’s overall season average blends performance against both lefties and righties, which can mask significant differences in matchup-specific output.
Do stolen bases count toward total bases props?
Settlement rules vary by sportsbook. Most UK operators count only bases earned through hits (singles, doubles, triples, home runs) and exclude bases reached via walks, hit-by-pitches or stolen bases. Always check your operator’s specific settlement terms before placing a total bases prop.
Published by the Betting for Baseball team.