Baseball Betting During the All-Star Break: Strategies for the Mid-Season Pause
 Available in US
The Mid-Season Reset That Most Bettors Ignore
Every July, MLB shuts down for four days. The All-Star Game takes centre stage, the regular schedule pauses, and most casual bettors check out entirely. I used to be one of them — treating the break as dead time, a chance to step away from the screens. Then I realised that the All-Star break is one of the most productive windows of the entire betting calendar, not despite the pause but because of it.
The break falls almost exactly at the season’s halfway mark, with roughly 80 games played and 80 remaining. That split creates a natural evaluation point. First-half data is large enough to be meaningful but small enough that second-half adjustments have not yet been priced in. The market enters a brief lull — sportsbooks reduce staff attention, pricing models coast on stale inputs, and the betting public’s focus drifts to the exhibition game itself. For anyone willing to do the analytical work during those four quiet days, the edges available immediately after the break are among the most reliable of the season.
MLB attendance topped 70.75 million fans across the 2023 regular season, and the All-Star Game consistently draws one of the largest single-event television audiences in American sports. All that attention on the exhibition creates a blind spot: while everyone watches the stars, nobody is studying the teams those stars will return to. That asymmetry is the foundation of every strategy I am about to describe.
See also: rivalry series after the break offer edge — read our divisional rivalry betting guide.
Futures Markets Shift at the Halfway Point
The single most valuable activity during the All-Star break is reassessing futures positions. Division races, pennant markets and World Series odds all recalibrate based on first-half results, and the recalibration frequently overshoots or undershoots reality.
A team that started 45-35 might see its division futures price compress from 3/1 to 6/4, even if the underlying performance indicators — run differential, pythagorean win expectation, rotation health — suggest the record is slightly inflated by close-game luck. I have tracked this pattern across multiple seasons: teams with a positive record but a negative run differential at the All-Star break regress in the second half roughly 70% of the time. Their futures price at the break is the worst value you will find all year. Conversely, teams with a mediocre record but strong underlying metrics — high run differential, good FIP across the rotation — are underpriced at the break because the public fixates on the standings rather than the process.
The global baseball market stands at $11.35 billion in 2025, projected to grow toward $15.39 billion by 2030, and futures represent a growing slice of that betting volume. UK sportsbooks adjust their MLB futures odds during the break, sometimes posting new prices within hours of the All-Star Game. If you have done your homework before those new prices appear, you can move faster than the market corrects.
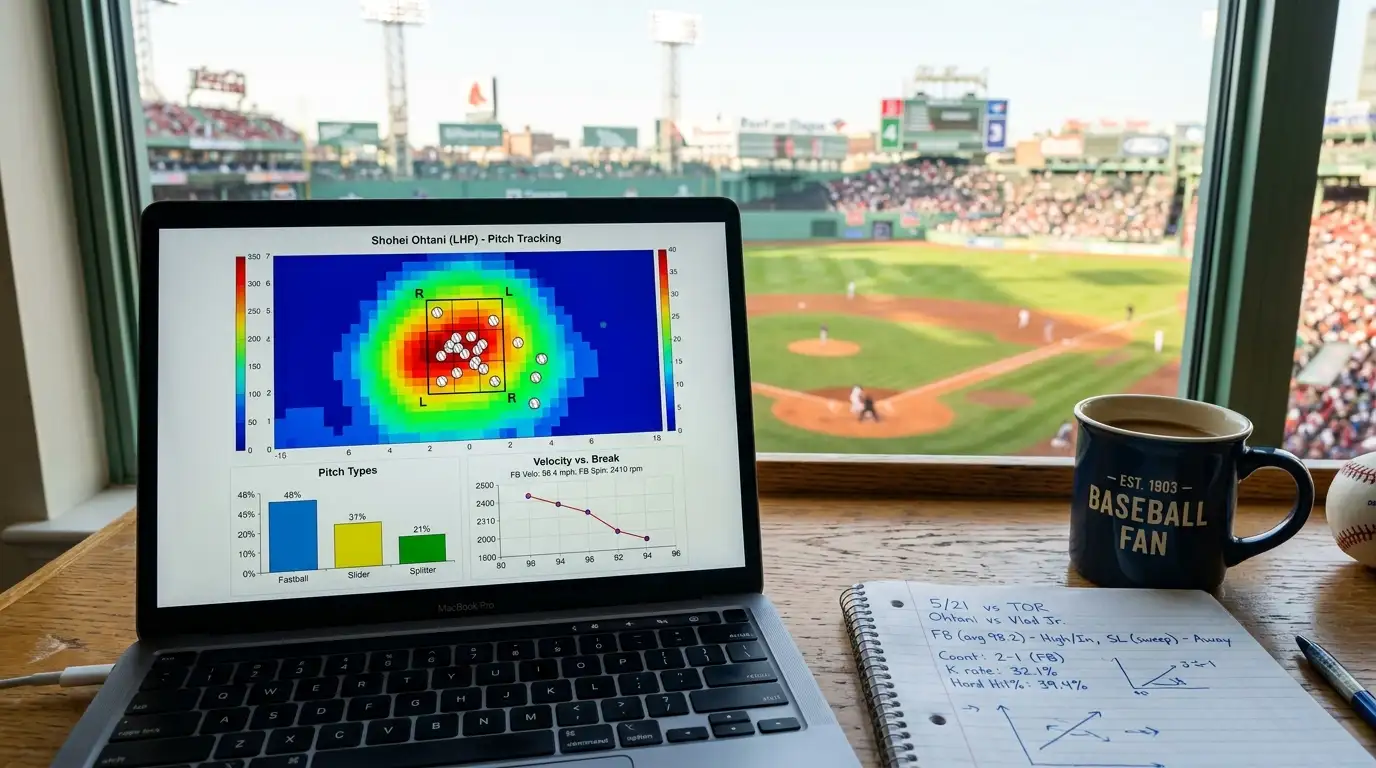
My approach: I build a simple spreadsheet comparing each team’s actual wins to their pythagorean expectation (a formula that predicts wins based on runs scored and allowed). Any team overperforming by three or more wins is a fade candidate in the futures market. Any team underperforming by three or more wins is a buy candidate. This filter alone eliminates half the league and focuses attention on the eight to ten teams where the market is most likely mispriced.
All-Star Game Betting: Exhibition Odds and Props
Betting the All-Star Game itself is a different exercise from betting the regular season, and treating it the same way is a reliable path to losing money. The rosters are assembled for entertainment, not competition. Managers use every available pitcher for one or two innings. Starters rarely play beyond the fifth inning. The incentive structure — pride and home-field advantage for the World Series were removed years ago — means effort levels fluctuate unpredictably.
That said, there are angles. The total is the market I focus on almost exclusively for the exhibition. All-Star Games tend to be lower-scoring than regular-season averages because elite pitchers, even in short stints, suppress offence more effectively than league-average arms. The parade of relievers — each throwing one inning of maximum effort — creates a pitching-dominated environment that regular-season totals models do not capture. Over the past decade, the Under has hit at a rate above 55% in All-Star Games, which is a meaningful edge at even-money odds.
MVP props are the other playable market. The All-Star Game MVP almost always goes to a batter who hits a home run in a decisive moment or a pitcher who strikes out the side in a key inning. Backing a power hitter from the host city’s team — who typically receives extra at-bats and has the crowd behind him — has been a profitable long-term approach. The sportsbook prices MVP candidates evenly across the roster, but performance and opportunity are not evenly distributed.
Second-Half Adjustments: What Changes After the Break
I keep a checklist that I review every year during the break. It covers five variables that reliably shift between the first and second halves of the MLB season, each one affecting specific betting markets.
Pitching workload is the most important. Starters who threw heavy innings in the first half — particularly those exceeding 110 innings by the break — show measurable performance decline in August and September. Their FIPs rise, their strikeout rates drop, and their pitch velocity decreases by roughly 0.5 to 1.0 mph. If a team’s ace is approaching that workload threshold, their second-half moneyline and totals prices are too low for the adjusted reality. MLB set a record 3,617 stolen bases in 2024, partly because base runners exploit fatigued arms in the second half — tired pitchers hold runners less effectively and deliver to the plate more slowly, inflating steal attempts and run-scoring opportunities.
The trade deadline falls roughly two weeks after the All-Star break, and its anticipation distorts team behaviour. Contenders push harder, acquiring reinforcements that immediately improve their roster. Sellers shed veterans, weakening their lineup and bullpen. The futures market partially prices in expected trades, but the specific moves are unknown until they happen. Betting on contenders before the deadline — when their price reflects only their current roster — captures value that the post-deadline market will compress.
Bullpen fatigue accumulates differently from rotation fatigue. Relievers who have appeared in 40+ games by the break are statistically more likely to post elevated ERAs in August. This effect is particularly visible in live in-play markets, where late-inning bullpen matchups drive real-time odds movement. If a team’s high-leverage relievers are overworked at the halfway point, their in-play value deteriorates faster than the pre-game line suggests.
Schedule density tightens in the second half. Teams play more games in fewer days, with fewer off-days to rest pitchers and reset lineups. This compression benefits teams with deeper rosters and hurts teams reliant on a short rotation or a thin bullpen. Depth is the variable most likely to be underpriced at the break because it only reveals its value under second-half stress.
See also: betting for baseball for seasonal trends and mid-year analysis.
Putting the Break to Work: A Four-Day Plan
Day one: pull first-half data for all 30 teams. Actual record, pythagorean record, run differential, rotation FIP, bullpen ERA, OPS splits. This takes about two hours with publicly available data sources and a basic spreadsheet. It is the foundation for everything that follows.
Day two: compare your pythagorean projections to the current futures prices at your UK sportsbook. Flag teams where the market diverges from your model by more than three wins in either direction. These are your second-half targets. About 68% of UK bettors plan to increase their activity in 2026, and many of those bettors will re-engage after the All-Star break without doing this analysis — which is precisely why the edges exist.
Day three: review pitching workloads. Identify starters approaching fatigue thresholds and bullpen arms that are overexposed. Cross-reference these with the teams you flagged on day two. A team that looks strong on the standings but has an overworked rotation and bullpen is a second-half fade candidate even if the futures price has not adjusted yet.
Day four: place your futures bets and set up your second-half tracking system. The break ends, and the market resumes with fresh prices. If you have done the work on days one through three, you are entering the second half with a structural information advantage over every bettor who treated the break as time off. The four days of quiet are not dead time — they are the most efficient research window of the entire season.
Can you bet on the MLB All-Star Game at UK sportsbooks?
Yes. Most UKGC-licensed sportsbooks offer moneyline, totals and MVP props for the All-Star Game. The market is thinner than regular-season games, and the exhibition format makes outcomes less predictable, so approach it differently from standard MLB betting.
Do MLB teams perform differently after the All-Star break?
Teams with overworked pitching staffs, negative run differentials despite positive records, and thin rosters tend to decline in the second half. The break is an ideal time to reassess futures positions using first-half data and pythagorean win projections.
Published by the Betting for Baseball team.